- Applying Audience to Chart
- Applying Audience as Chart Base
- Applying Audience to Crosstab
- Applying Audience as Crosstab base
Applying an Audience to a Chart
Audiences help you define exactly who you want to understand. Whether you’re starting from scratch or tweaking a ready-made GWI persona, it’s your space to build the audience that fits your goals. For more detail on creating an audience via our API, see Create audiences. You can apply audiences to focus your analysis on the people you want to understand. If you don’t add an audience, your analysis will be calculated for the default population of the dataset. E.g. for GWI Core, the default population is “All Internet Users - age 16-64” (or 16+ in some markets). There are two ways to apply an audience: you can apply one or more audiences while keeping the same overall base, or apply an audience as the base. If no audience is provided, the chart is calculated using the default population of the dataset. The example below shows an audience applied to the chart. The results show how that specific audience compares across working status, but the base of the analysis remains all internet users.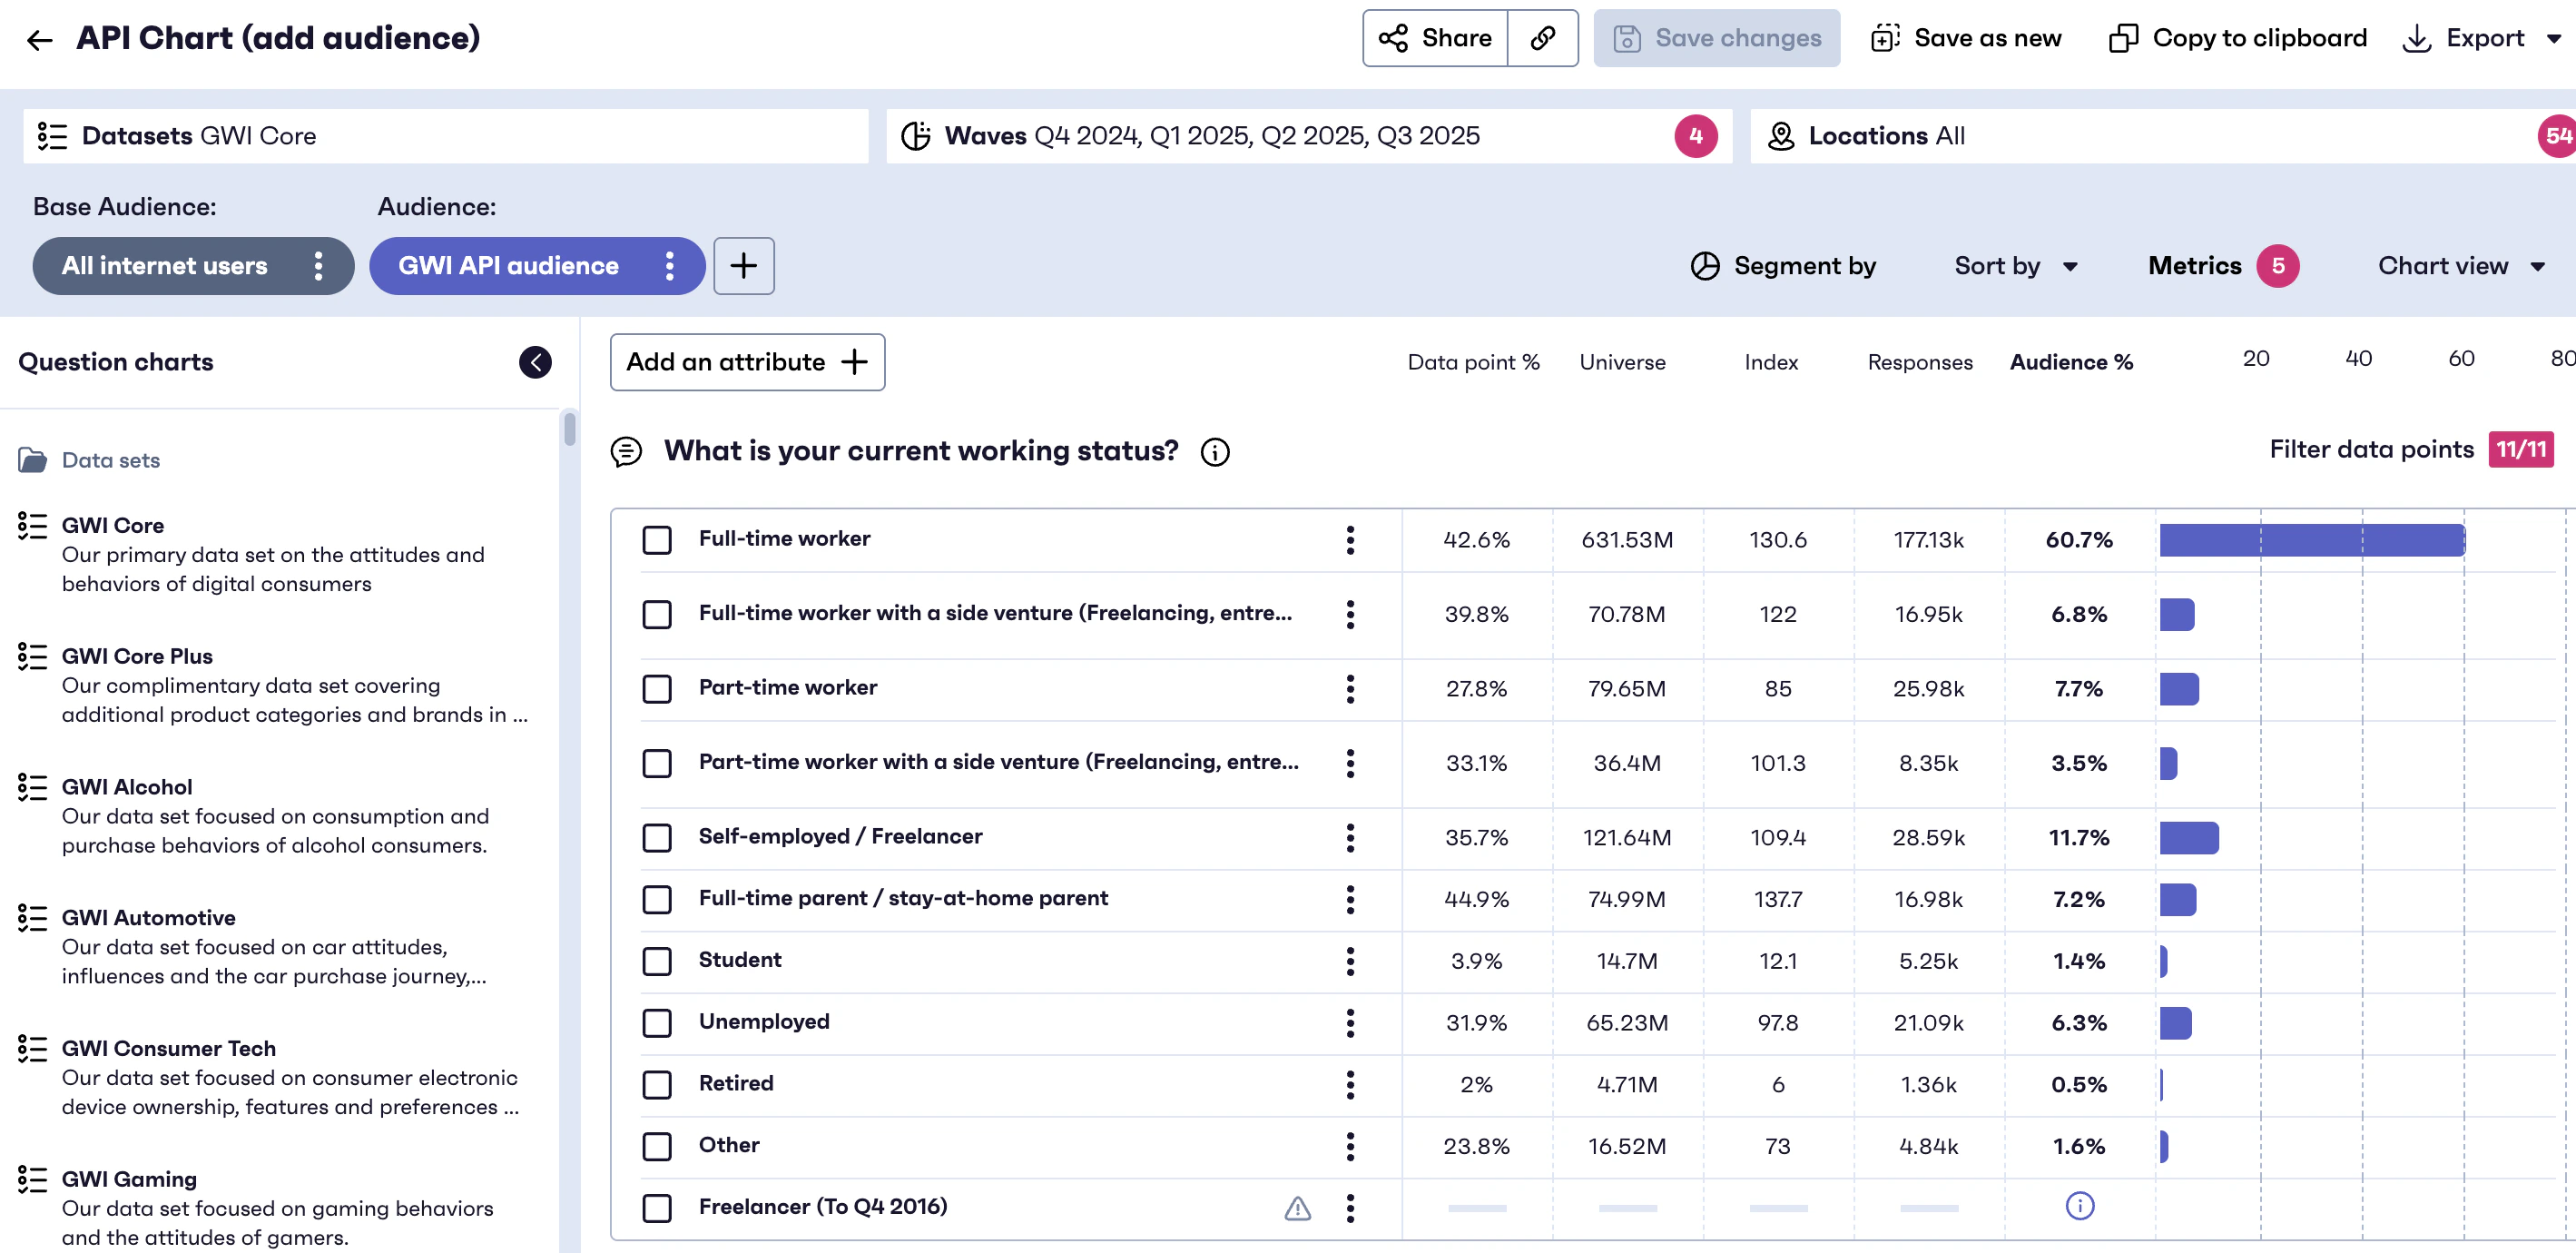
How it works
To apply one or more audience(s) to your chart:- Identify the audience(s) you want to use (pre-defined or dynamically constructed).
- Include the audience identifier in your chart request payload.
- The API calculates all metrics to show how your selected audience(s) performs across the chart attributes.
Applying an Audience as a Base to a Chart
The base refers to everyone that’s included in your analysis. Think of it as your reference point. By default, the base includes everyone that’s represented by the data set you’ve selected (e.g. all internet users aged 16+ for GWI Core), but sometimes you may want to apply a more specific filter to your analysis and change your reference point entirely, so all results are recalculated using a specific audience as a filter. When an audience is applied as a base, all percentages and metrics are calculated using that audience as the denominator. The example below shows an audience applied as a base. The results show how that audience compares across working status, with the analysis calculated using that audience as the base population.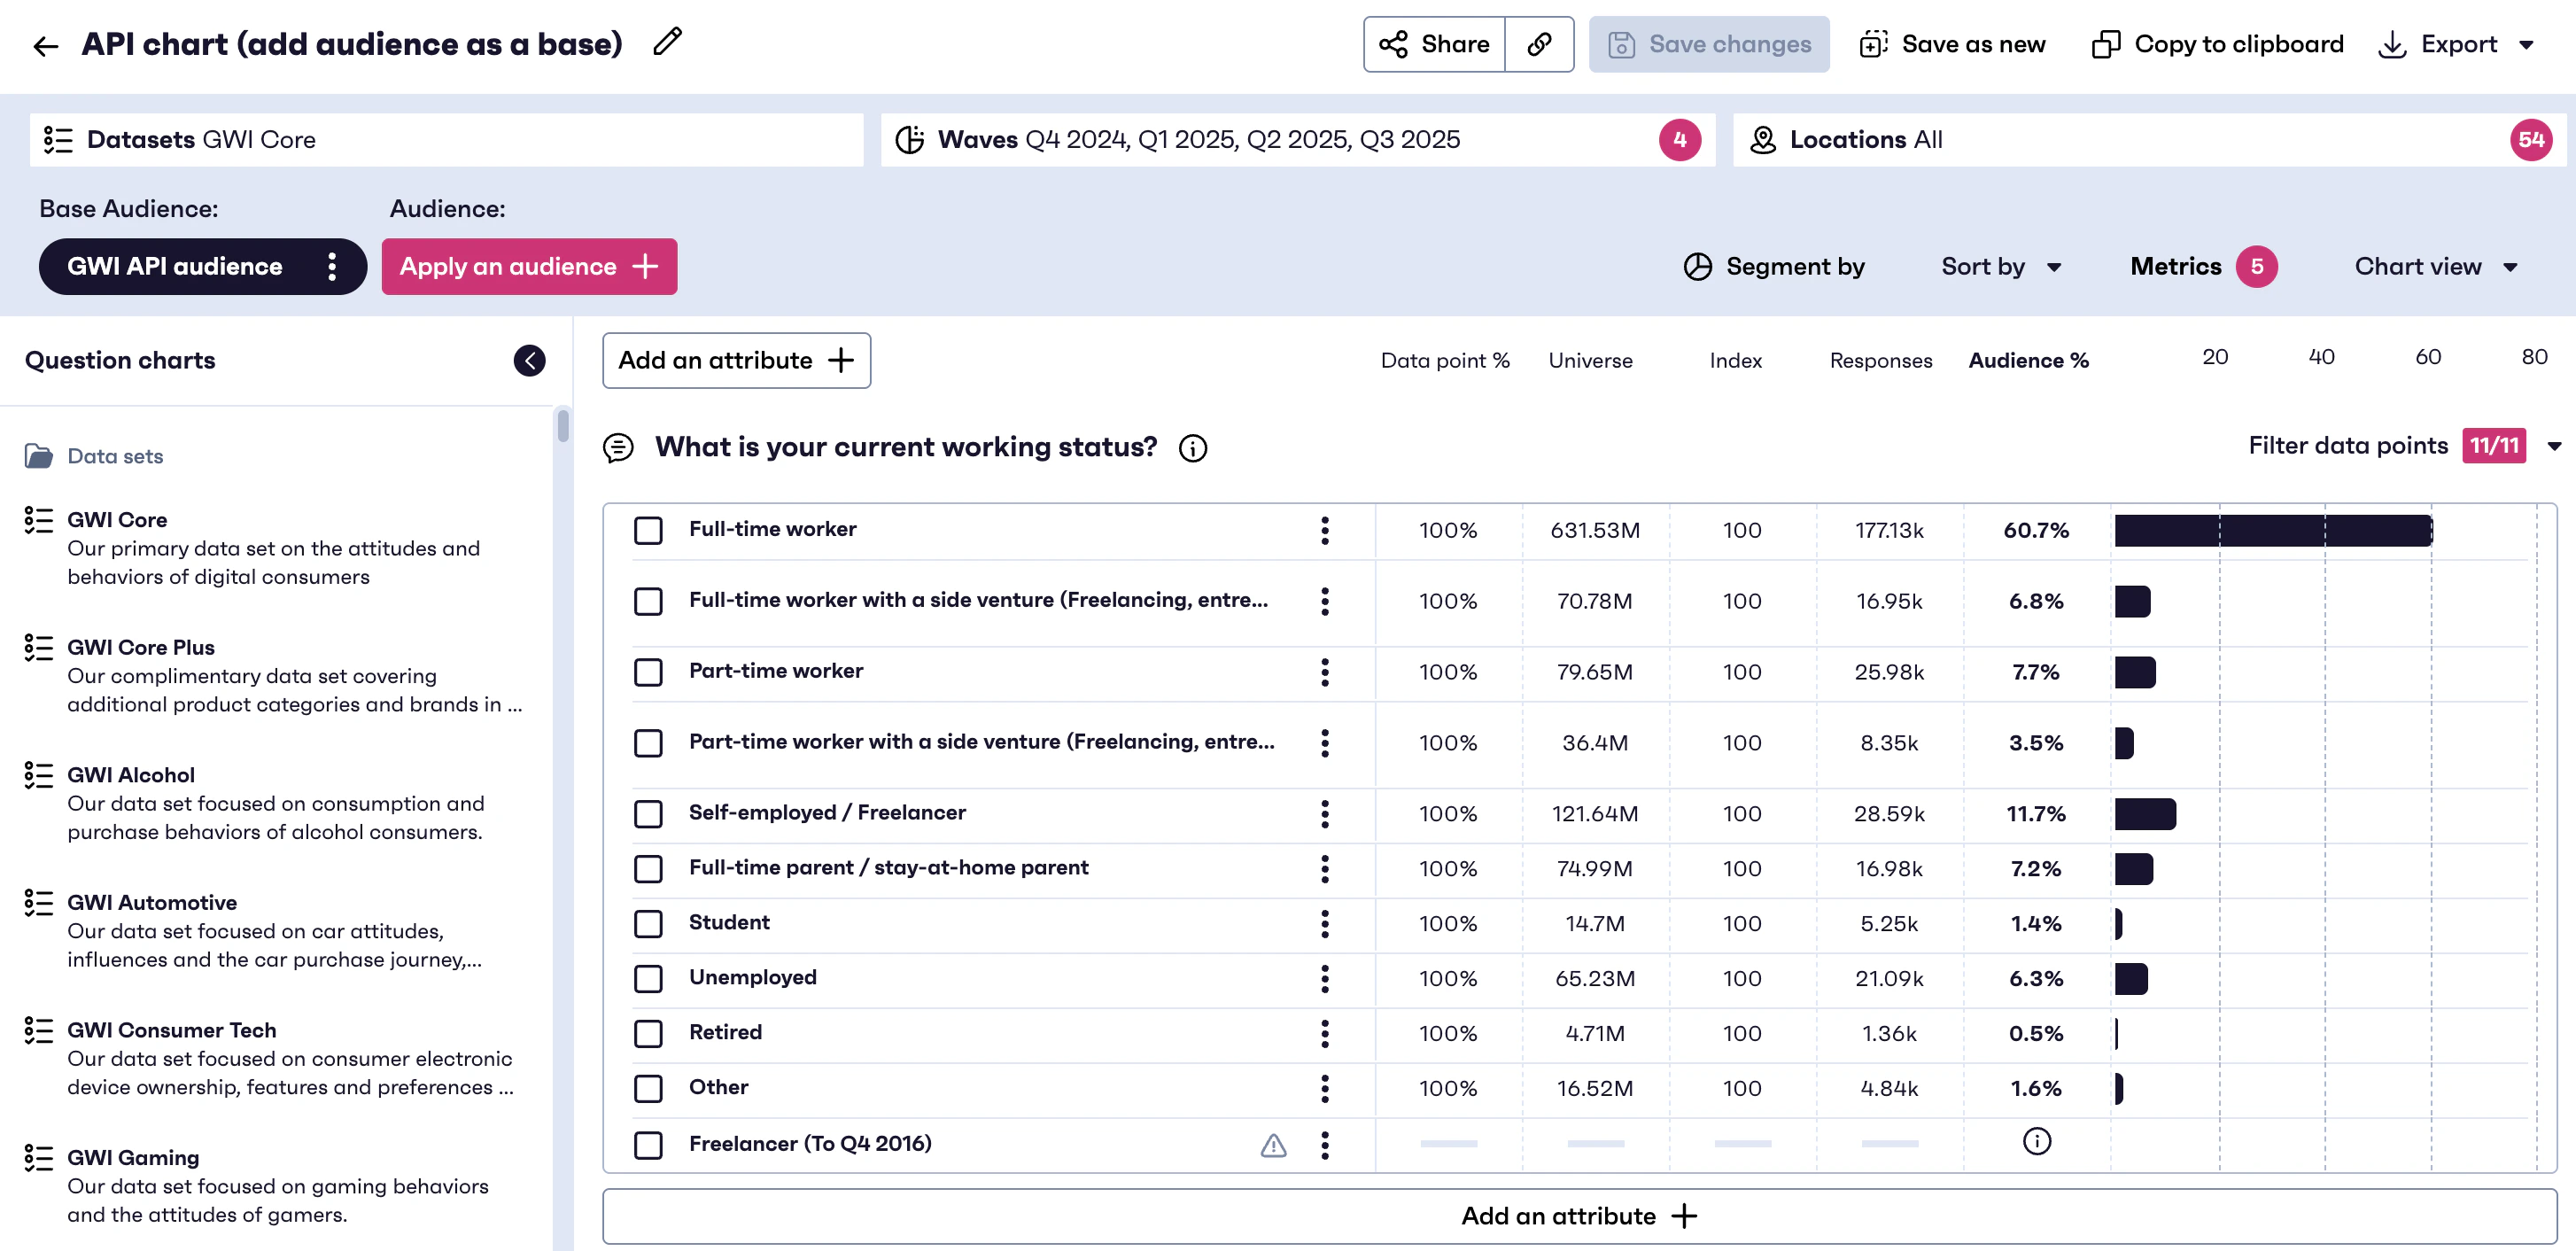
How it works
- Create or retrieve the audience you want to use.
- Include the audience identifier in your chart creation request as the base audience.
- The API calculates all results relative to that audience population.
You can use the cURL below to replicate the chart example and adapt it to your use case.
Applying an Audience to a Crosstab
You can apply audiences to focus your analysis on the people you want to understand. If you don’t add an audience, your analysis will be calculated for the default population of the dataset. E.g. for GWI Core, the default population is “All Internet Users - age 16-64” (or 16+ in some markets). There are two ways to apply an audience: you can apply one or more audiences while keeping the same overall base, or apply an audience as the base. For more information on how crosstabs work on our platform, you can find it on our help center article. The example below shows an audience applied to the crosstab as a column. The results show how that specific audience compares across working status, but the base of the analysis remains all internet users.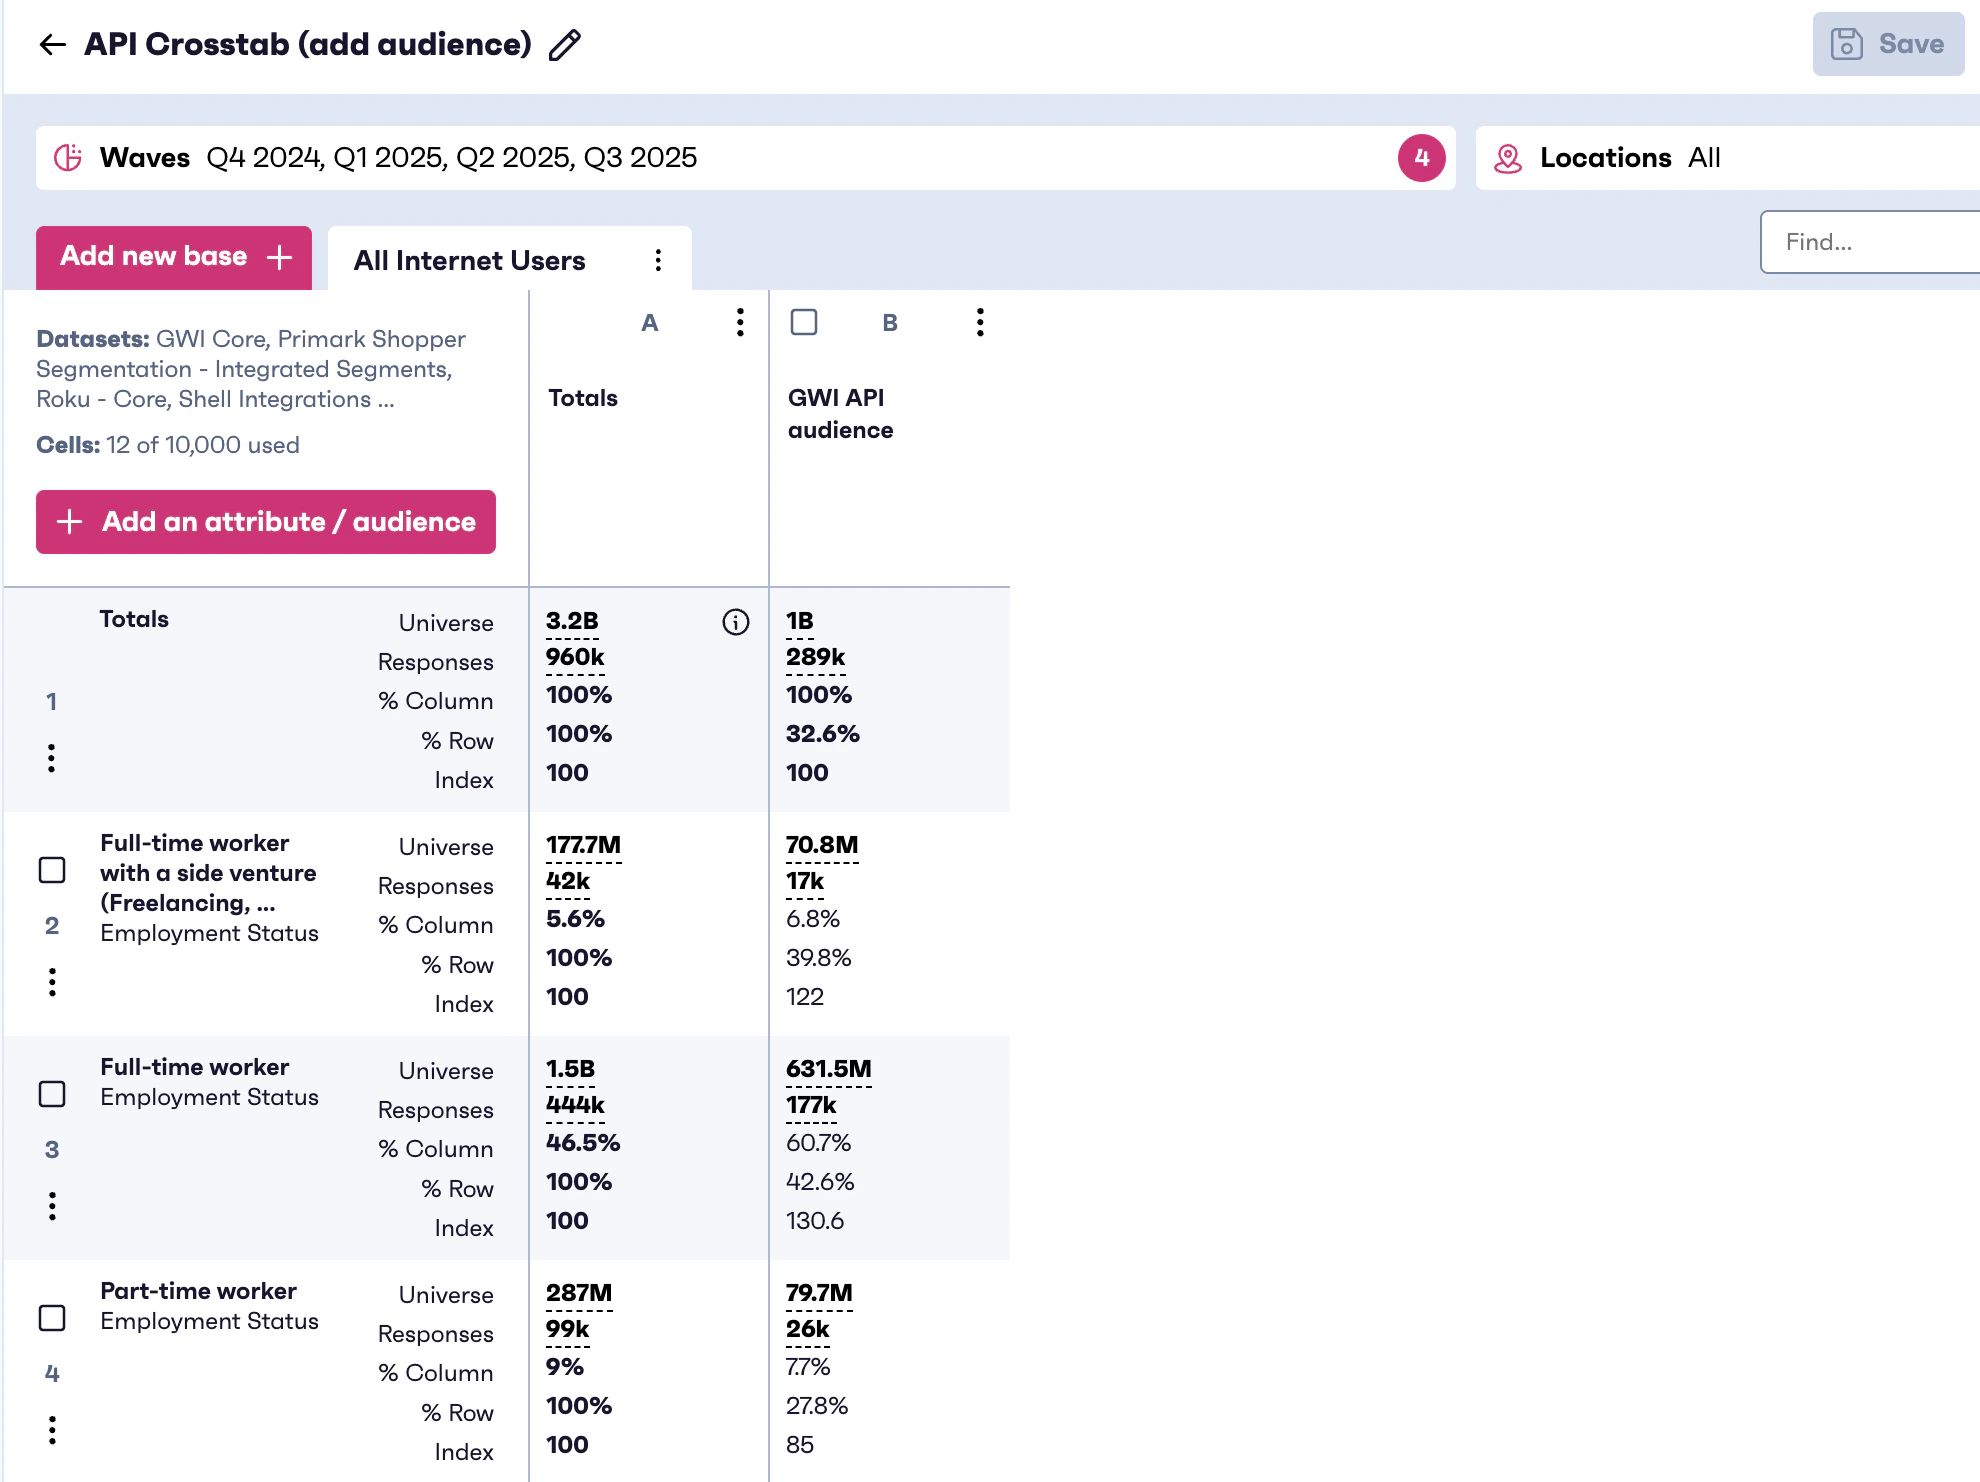
How it works
- Identify the audience(s) you want to use (pre-defined or dynamically constructed).
- Include the audience(s) either as rows or columns in your code.
- The API calculates all row and column metrics using only respondents in that audience.
Applying an Audience as a Base to a Crosstab
The base refers to everyone that’s included in your analysis. Think of it as your reference point. By default, the base includes everyone that’s represented by the data set you’ve selected (e.g. all internet users aged 16+ for GWI Core), but sometimes you may want to apply a more specific filter to your analysis and change your reference point entirely, so all results are recalculated using a specific audience as a filter. When an audience is applied as a base, it defines the denominator for all row and column calculations in the crosstab. The example below shows an audience applied as a base. The results show how that audience compares across working status, with the analysis calculated using that audience as the base population.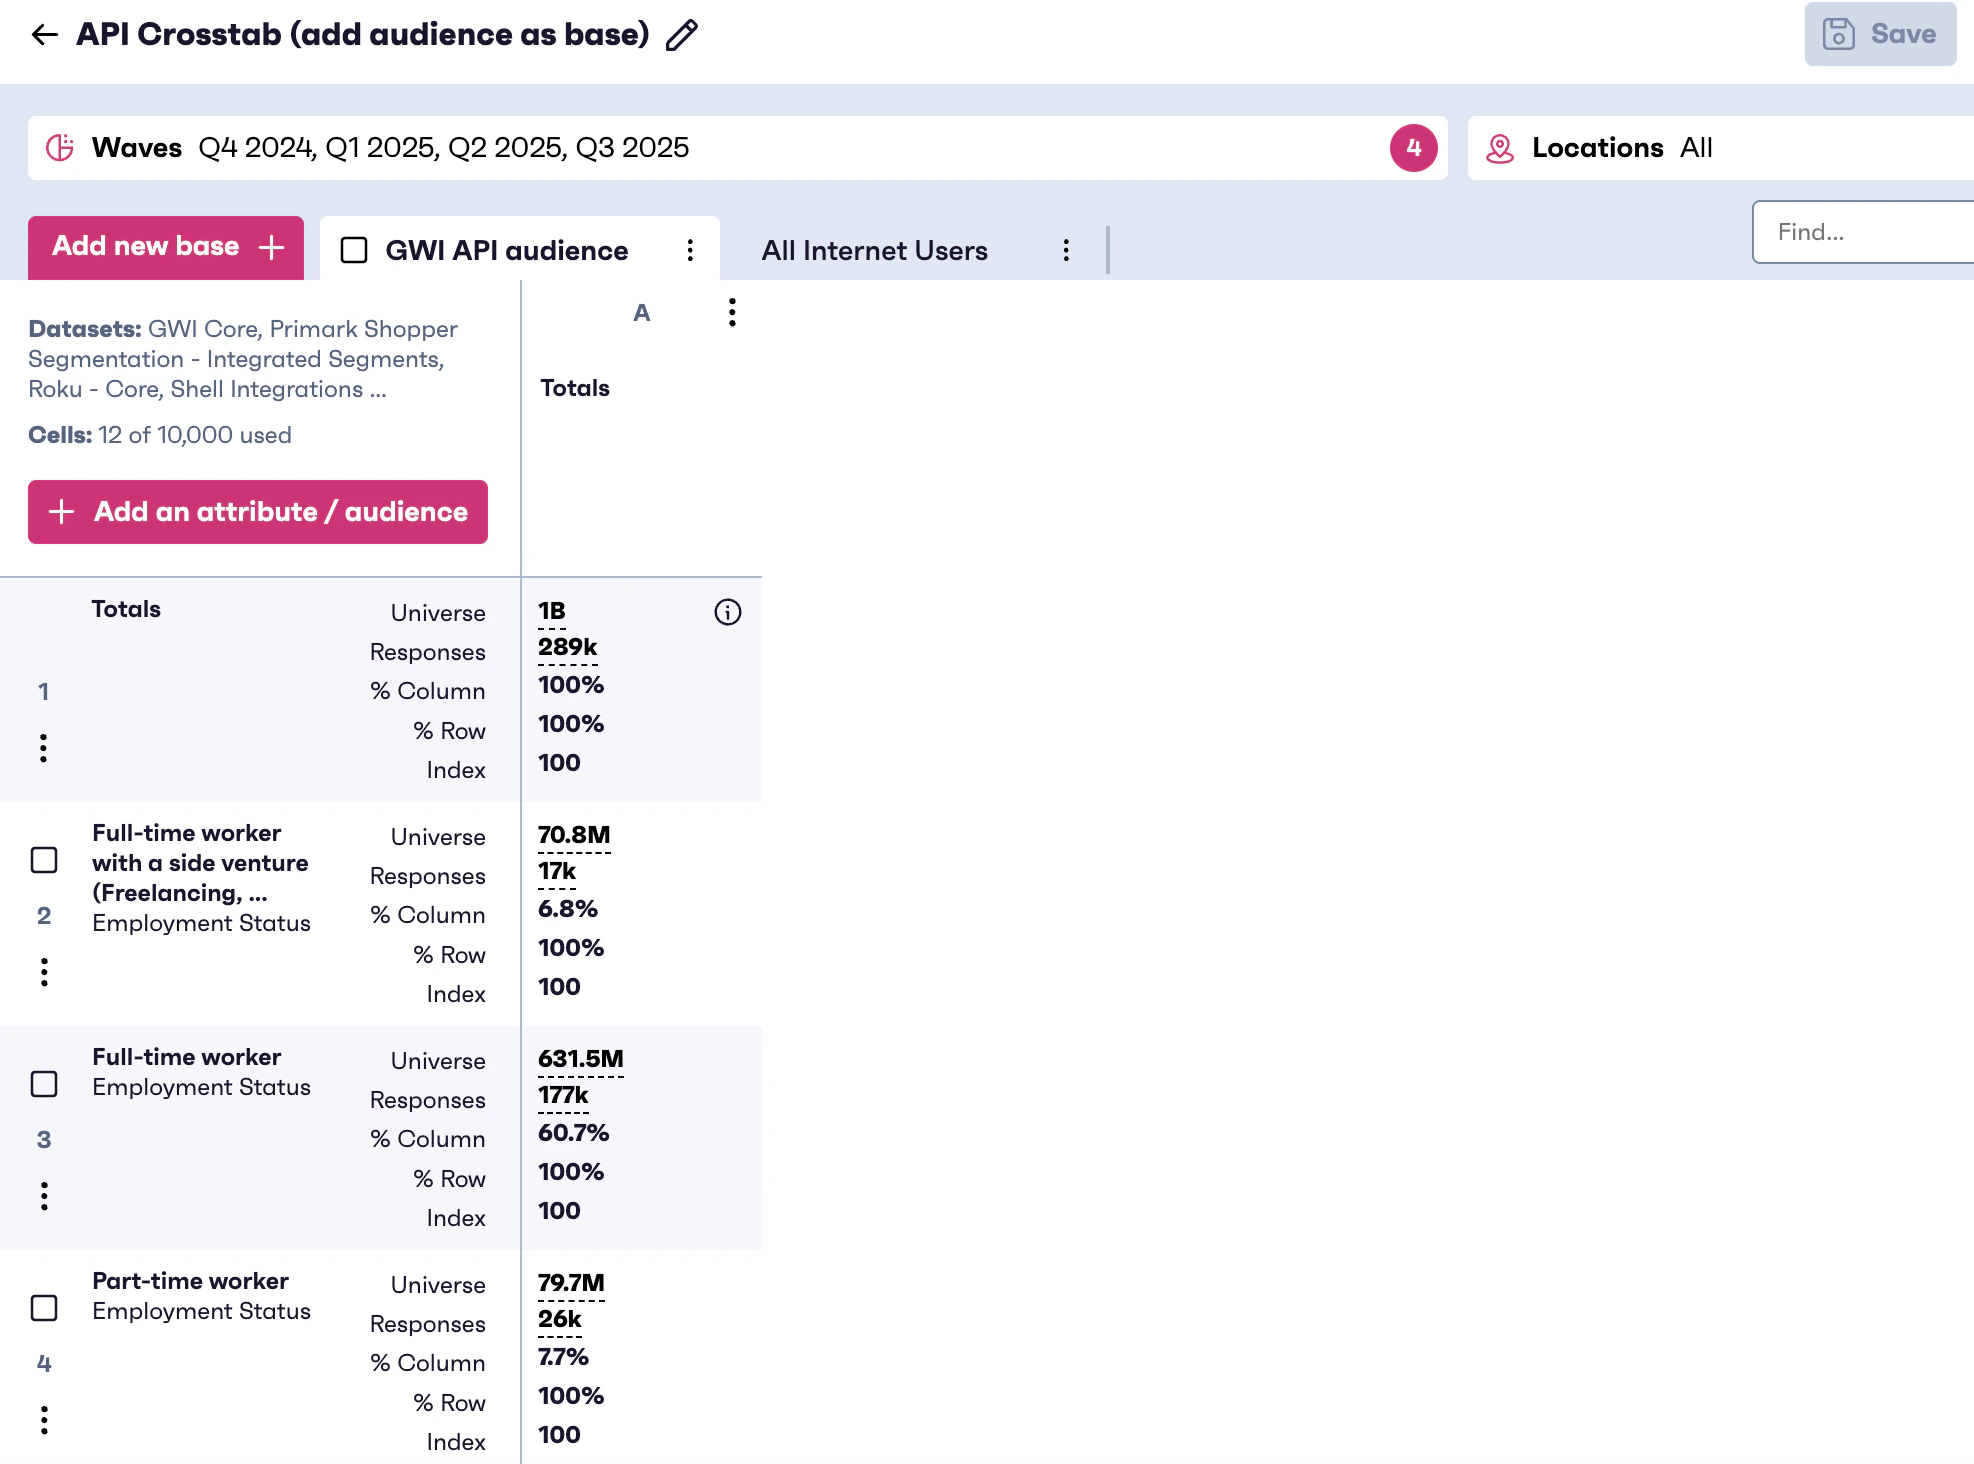
How it works
- Create or retrieve the audience you want to use.
- Include the audience identifier in your crosstab request as the base audience.
- The API calculates all cross-tabulated metrics relative to that audience population.